Producing Google Chrome diagnostic logs
- Open a new tab in your Chrome Browser
-
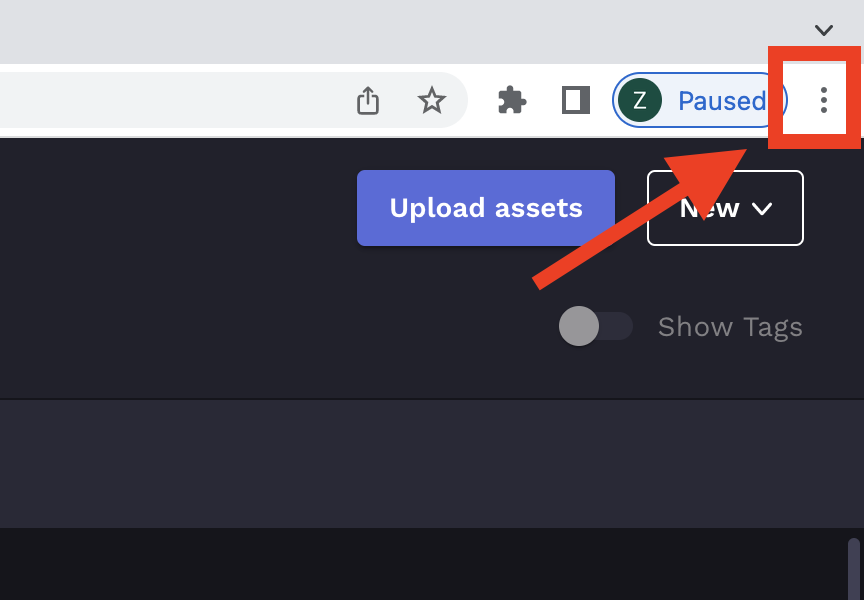
Click on the ellipsis menu in the upper right hand corner
- Click on More Tools > Developer Tools
- Navigate to your Vizit instance.
- Wait until you get a black screen trying to access your Vizit instance.
-
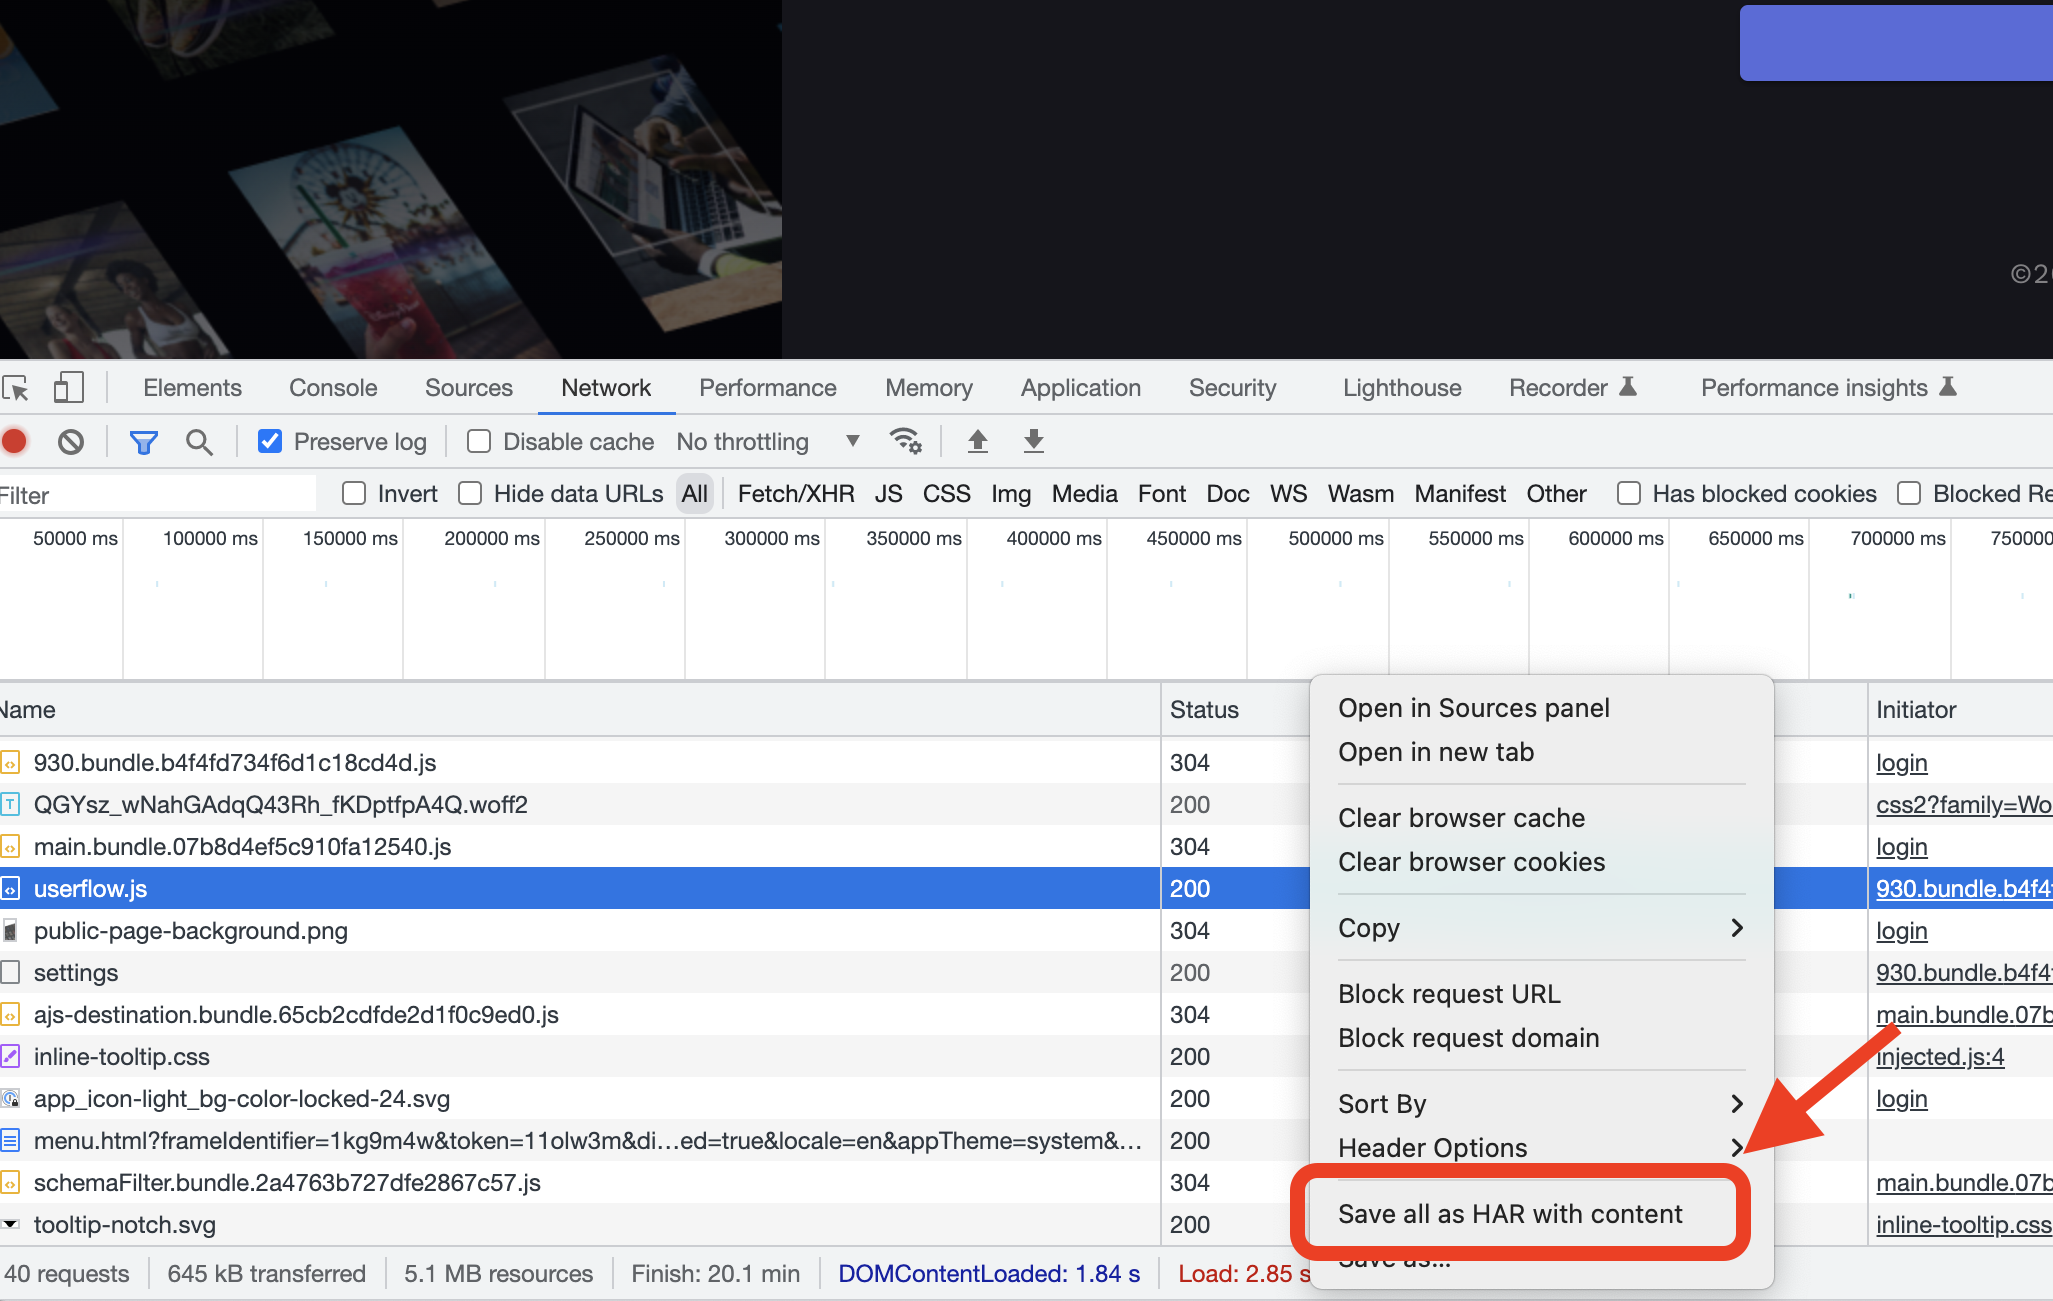
Click on the Network tab, right click on the table in the tab and select Save all as HAR with content. (this will generate a HAR file)
-
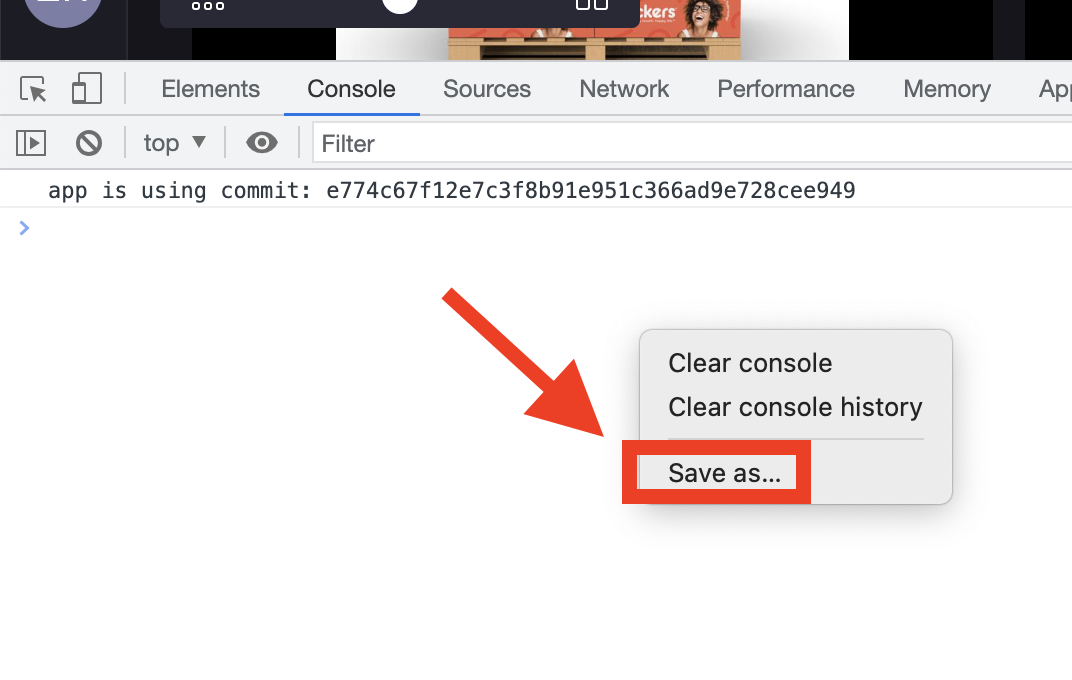
Click on the Console tab, right click on the table in the tab and select Save As.... (this will generate a log file)